
When traffic or conversions suddenly spike or drop, hours matter. Automated anomaly detection surfaces those moments—good and bad—without waiting for a weekly review. Done right, it shortens time-to-fix for issues and time-to-capitalize for opportunities.
What “anomaly” actually means
An anomaly is data that deviates from its expected pattern given normal seasonality and trend. In web analytics, you’ll typically meet three flavors:
- Point anomalies: One-off spikes/dips (e.g., checkout failures after a release).
- Contextual anomalies: Values that are unusual for this context (e.g., low weekday revenue at 8–10am compared to typical weekday mornings).
- Collective anomalies: A sustained run outside norms (e.g., a 3-day slide in add-to-cart rate due to a pricing change).
Your goal is not to flag every wiggle—it’s to catch meaningful deviations early with low noise.
Why marketers and product teams need it
- Protect revenue: Detect broken pixels, tracking outages, out-of-stock cascades, or failed payment gateways before a day is lost.
- Seize upside: Identify winning campaigns/creatives or viral mentions while they’re hot.
- Reduce manual monitoring: Replace dashboard babysitting with targeted, actionable alerts.
- Build trust: Consistent, explainable detection (and fewer false alarms) increases leadership confidence in analytics.
Data you should monitor (start small, expand fast)
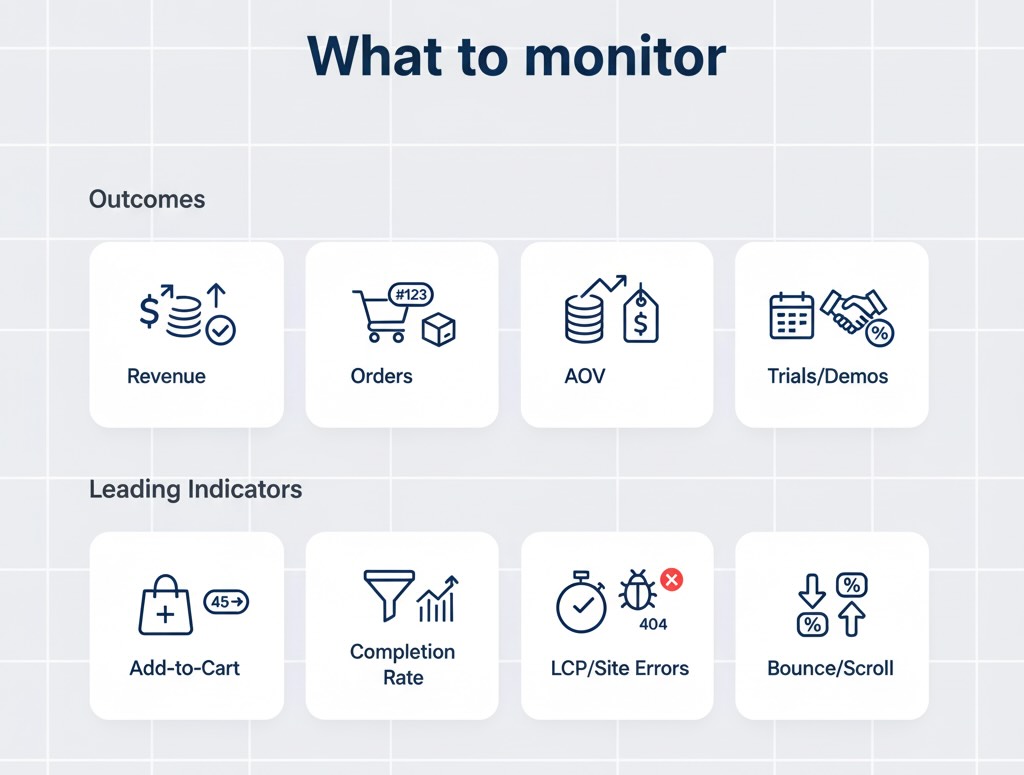
Prioritize business outcomes, then leading indicators:
Outcomes
- Revenue, orders, AOV
- Trial starts, demo requests, paid upgrades
Leading indicators
- Add-to-cart, checkout start/complete
- Landing page bounce, scroll depth on key pages
- Site speed (LCP), error rates, 404s
- Channel/segment breakouts (brand search, paid social, email, affiliates; new vs returning; device)
Tip: Alert on rates as well as counts (e.g., checkout completion rate, not just orders). Rates are more robust to everyday traffic swings.
How automated detection works (without the math headache)
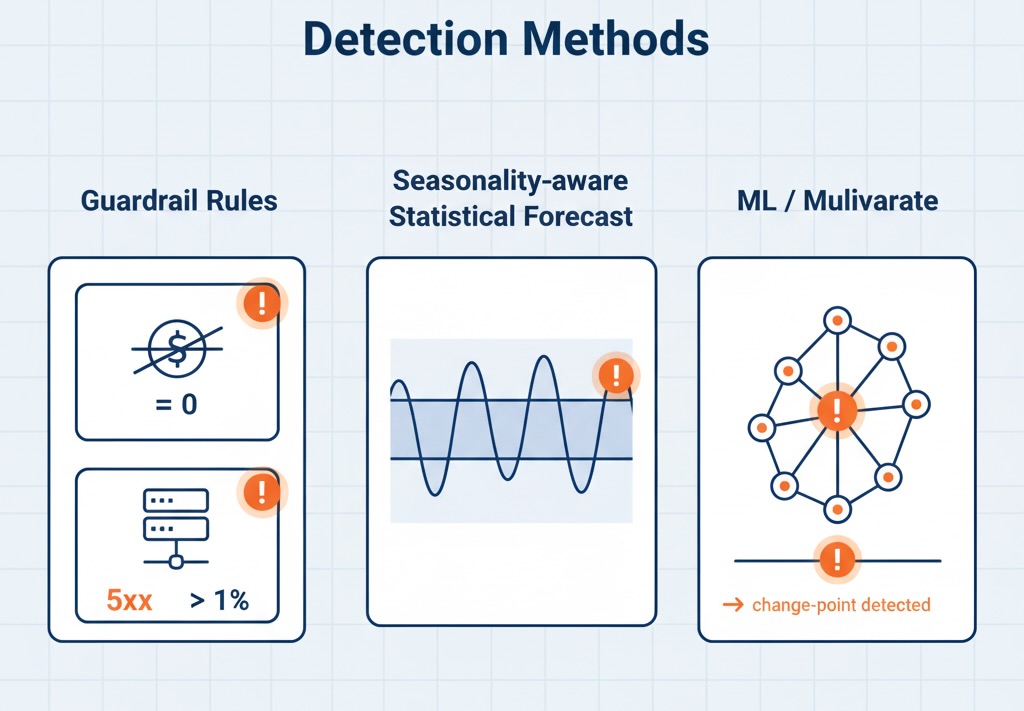
Most modern systems blend three approaches:
- Baseline + thresholds (rules you can trust)
Simple but effective for guardrails. Examples:
- “Alert if revenue = 0 for 15 minutes.”
- “Alert if 5xx rate > 1% for 5 minutes.”
Great for binary failures. Weak for seasonal behavior.
- Statistical models (seasonality-aware)
The model forecasts an expected value and confidence band using past data. When reality falls outside the band, you get a signal. Methods range from:
- Decomposition + smoothing (trend + weekly/diurnal seasonality)
- Control charts (e.g., rolling mean ± k*std, EWMA)
- Forecasting models (ARIMA-class, Prophet-style, STL + robust residuals)
- Machine learning (multivariate + adaptive)
When multiple signals move together, ML can catch patterns rules miss:
- Isolation Forest / One-Class SVM / LOF for outlier detection across many metrics.
- State-space / Bayesian models that adapt to gradual level shifts without flagging them as anomalies.
- Change-point detection to spot sustained regime shifts after a price, policy, or UX change.
You don’t need to pick one forever. Many teams run rules for hard fails, seasonal stats for core KPIs, and ML for multivariate context.
Real-time vs. batch: choose by the cost of delay
- Real-time (minute-level): Payments, availability, tracking health, traffic integrity.
- Hourly/daily batch: Marketing performance, content engagement, SEO traffic, lead quality.
Match granularity to the decision horizon. Finer intervals mean noisier signals; compensate with aggregation windows and minimum sample thresholds.
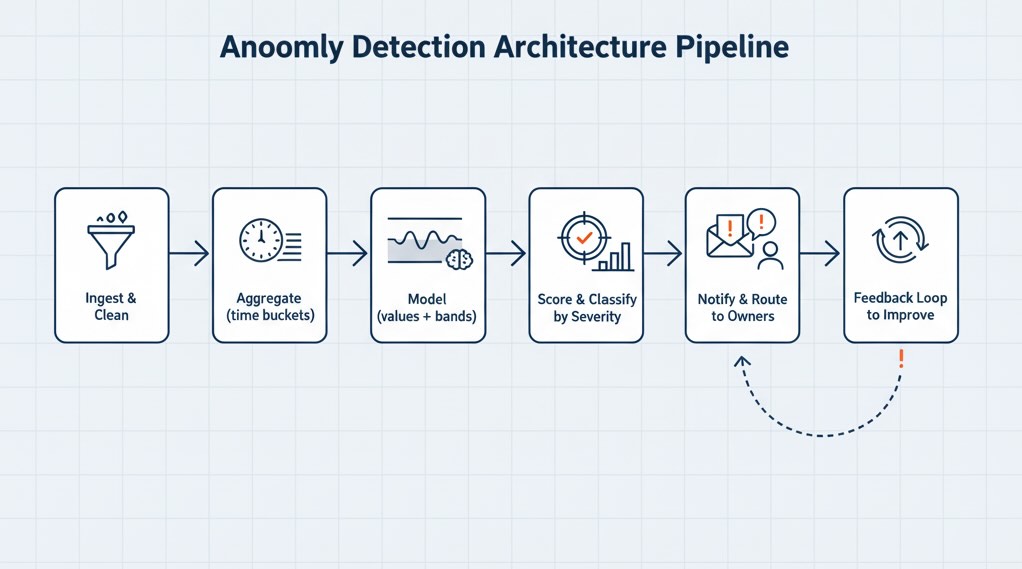
Architecture in one glance
- Ingest & clean: Stream events (e.g., product views, add-to-carts, purchases) and key dimensions (channel, device) into a warehouse or stream processor.
- Aggregate: Build stable metrics (counts and rates) in time buckets (1–60 min; daily).
- Model: Compute expected values + bands per metric/segment.
- Score & classify: Flag anomalies, label severity (magnitude × business impact).
- Notify & route: Send alerts to the right owners (marketing, product, engineering) with context.
- Feedback loop: Analysts mark alerts as useful/noisy to retrain thresholds or models.
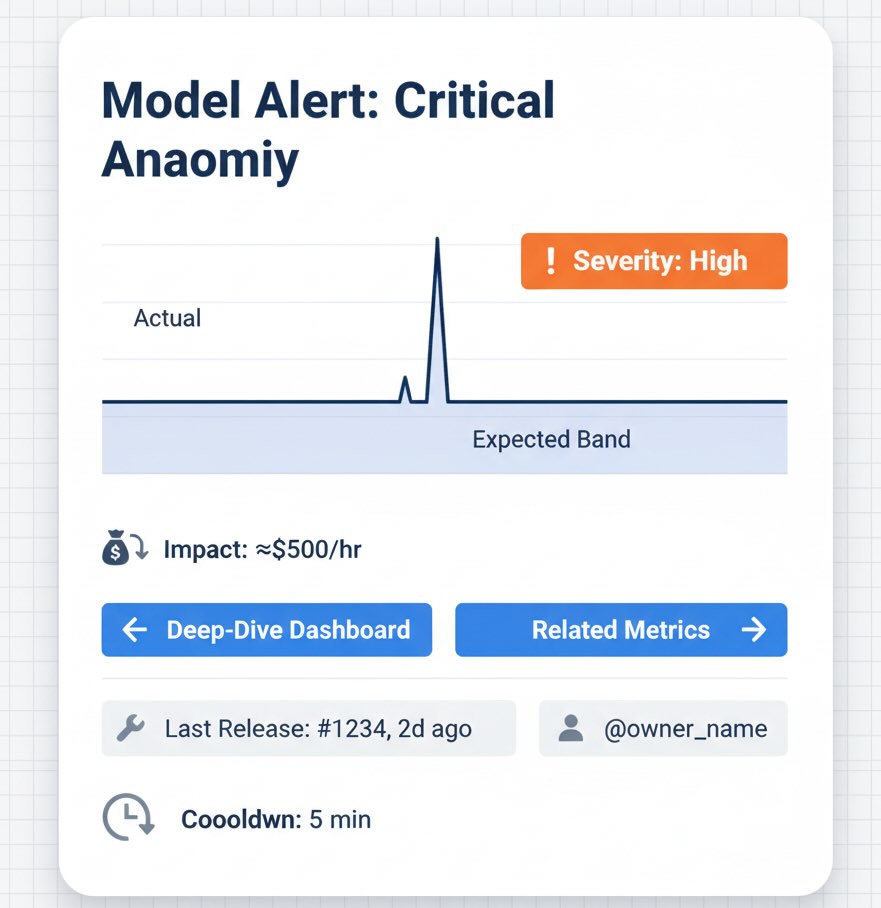
Designing alerts people won’t mute
- Business lens first: Include lost revenue/hour, affected pages, top channels hit, last release ID.
- Actionable context: Sparkline with baseline vs. actual, links to deep-dive dashboards, recent changes (deploys, price edits, promo starts).
- Severity tiers: Info (log only), Warning (asynchronous triage), Critical (page engineers/owners now).
- Deduplication & cooling period: Group related spikes; avoid ping-pong alerts during recovery.
Common pitfalls (and how to avoid them)
- Seasonality blindness
Weekend behavior ≠ weekday behavior. Model hour-of-week patterns (24×7) and holidays. If you only compare to the prior hour or day, you’ll alert constantly. - Denominator drift
A sudden drop in conversions might be traffic quality, not UX. Track rates (e.g., checkout completion) and segment by source to avoid misdiagnosis. - Alerting on vanity metrics
Pageviews fluctuate. Alert on business-linked metrics (e.g., PDP → cart rate) instead. - Data quality vs. user behavior
A tag outage looks like a revenue crash. Monitor tracking health (events per page, unique client IDs, tag response codes) alongside business metrics. - Static thresholds
A flat “10% deviation” is brittle. Use thresholds that scale with variance (wider bands when data is noisier; narrower when stable).
Measuring success (yes, measure the alerting system)
- MTTD (Mean Time to Detect): Minutes from deviation start to alert.
- MTTR (Mean Time to Respond): Minutes from alert to mitigation or decision.
- Precision (usefulness): % of alerts that led to action or insight.
- Recall (coverage): % of real issues caught (sample via post-mortems).
- Business impact: Saved revenue (critical defects), incremental revenue (captured spikes), reduced wasted spend (paused broken campaigns).
Set explicit targets: e.g., MTTD < 10 min for payments; alert precision ≥ 70% after Week 4.
Real examples marketers care about
- Creative goes viral: Social traffic triples at 9:42am; anomaly fires on “non-brand social → PDP views.” Action: pin offer, increase budget caps, stabilize inventory.
- Tracking regression: Deploy at 14:05; add-to-cart events fall 60% but PDP engagement is flat; tracking health anomaly triggers. Action: rollback tag, restore data continuity.
- Search update: Organic non-brand traffic down 18% specifically on category pages; anomaly clusters by template. Action: prioritize template fixes over chasing keywords.
Governance and explainability
Executives will ask “why did it alert?” Favor models you can explain in two sentences and include the baseline, the band, and the deviation in every alert. Keep a change log of threshold edits and model updates. Treat detection like any other product: version it, test it, and review it.
Bottom line
Automated anomaly detection is your early-warning system for web performance. Start with a handful of revenue-linked metrics, add seasonality-aware baselines, and layer multivariate models where they actually reduce noise. Route clear, contextual alerts to the right owners and measure the alerting system itself. You’ll fix issues faster, ride the upside sooner, and spend fewer mornings staring at dashboards hoping to spot the next surprise.