Predictive Analytics: Teaching Your Website to Predict User Actions

Predictive analytics turns yesterday’s browsing into tomorrow’s outcomes. Instead of asking “What happened?” you ask “What’s likely to happen next—and what should we do about it?” On a website, that means estimating a visitor’s probability to convert, churn, subscribe, return, or abandon—and then shaping the experience proactively. No code here, just the strategy so marketers, product managers, and analysts can use predictions responsibly and profitably.
What predictive analytics actually answers
At its best, predictive analytics frames actionable questions:
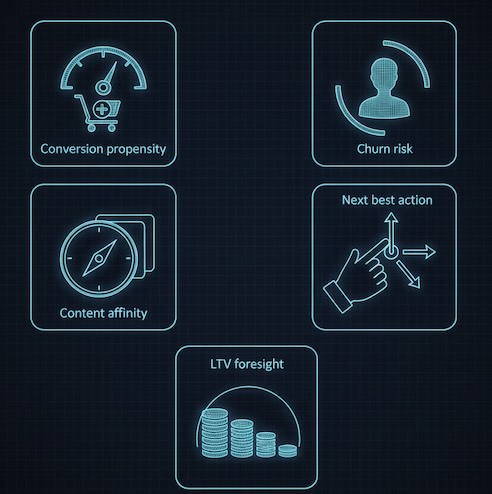
- Conversion propensity: What’s the chance this visitor completes checkout in this session?
- Churn risk (SaaS / membership): Which active users are likely to lapse in the next 30 days?
- Content affinity: What topic or product category is most likely to earn the next click?
- Next best action (NBA): Which nudge (social proof, comparison, incentive, tutorial) will lift the probability of progress for this person right now?
- Lifetime value foresight: Does this cohort look like high-LTV customers—and should we invest more to retain/acquire them?
Each question pairs a prediction (probability score, segment label, or ranked list) with a decision (personalize, prioritize, or pause).
The data your website already has

You don’t need exotic sources to start thinking predictively. First-party signals are often plenty:
- Behavioral: pages viewed, depth, scroll velocity, dwell time, search terms, element interactions.
- Contextual: device, network quality, referrer, geo, time of day, day of week, recency/frequency of visits.
- Commerce/product: categories viewed, variants toggled, cart edits, price sensitivity proxies (coupon usage, sort by “price”).
- Lifecycle: new vs. returning, free vs. paid, tenure, recent support interactions.
The point isn’t to accumulate every field—it’s to identify leading indicators that move earlier than your outcome (e.g., interacting with a size guide before purchase).
From reports to foresight: how predictions change decisions

Think of predictions as prioritization engines:
- Personalize content and sequence: High intent for “compare” behaviors? Lead with side-by-side specs and “best for” cues. Early-stage researcher? Offer a guide or quiz, not a hard CTA.
- Target support where it matters: Route live chat to visitors with high cart value and medium probability to convert (where help is likely to tip the outcome).
- Throttle or qualify promotions: Offer free shipping to users on the fence; with already-high propensity you can protect margin.
- Reduce churn with timely nudges (SaaS): If the model flags “setup stall,” trigger bite-sized onboarding tasks or show proof of value (“You saved 3 hours this week”).
- Focus sales outreach: For B2B trials, surface accounts whose in-app patterns mirror past wins, not just those with the most pageviews.
The thread: right message, right moment, right person—because you can now estimate the moment.
Choose the right outcome metrics
Leaders don’t buy AUC curves; they buy revenue. Evaluate predictions on:
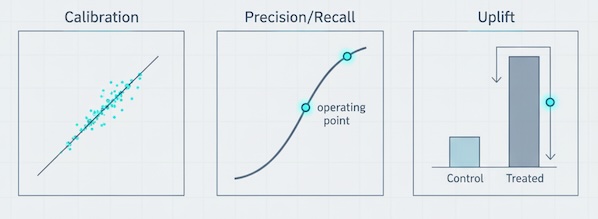
- Calibration: When we say 40% likelihood, does ~40% actually convert? Calibrated scores translate into credible forecasts and budgets.
- Precision/recall at the threshold you’ll use: If you only have capacity to act on 20% of traffic, what lift do you get on that slice?
- Uplift / incremental lift: Measure lift caused by the action vs. lift that would have happened anyway.
- Time-to-insight: How quickly a prediction becomes available in-session (real-time vs. next day) matters to outcomes.
- Business impact: Revenue, margin, retention, or cost-to-serve—whichever your program actually optimizes.
Report these side-by-side with a simple baseline (e.g., “target everyone who viewed pricing”) to prove the model’s edge.
Five practical use cases
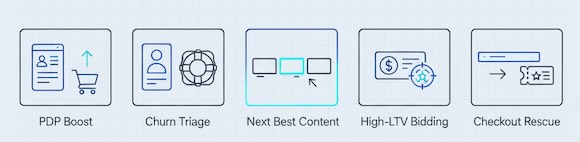
- Propensity-informed product pages (Retail/E-com)
Goal: lift PDP → Cart rate.
Good looks like: +10–20% TCR for mid-propensity cohorts after surfacing comparison help and delivery timelines. - Churn-risk triage (SaaS)
Goal: retain at-risk accounts without spamming everyone.
Good looks like: 15–30% reduction in voluntary churn among flagged users, with outreach volume capped. - Next best content (Media/Education)
Goal: increase depth and ad-safe engagement.
Good looks like: +12% session depth and +8% return rate from personalized “keep reading” rails tuned by predicted affinity. - High-LTV acquisition bidding (Paid Media)
Goal: buy better, not just cheaper.
Good looks like: Same CPA, +25% predicted LTV at day 30 versus last quarter. - Proactive checkout rescue
Goal: reduce abandonments without blanket discounts.
Good looks like: Offer appears on 20–30% of near-abandons; net margin up because you suppress incentives for high-propensity visitors.
Guardrails: ethics and privacy first

Predictive doesn’t excuse creepiness—or non-compliance.
- Consent and purpose limitation: Use first-party data within the scope users agreed to. No surprise enrichment.
- Minimize and aggregate: Favor behavioral patterns over sensitive attributes; keep features explainable.
- Fairness checks: Audit outcomes by region, device, or cohort to ensure your actions don’t penalize specific groups.
- Right to opt-out and forget: Respect user choices across predictions, not just raw data collection.
- Human-readable rationale: If you recommend a nudge, be able to explain why (“Checked return policy twice and added to cart—likely cost concern”).
Trust compounds. So does the damage from ignoring it.
Avoid these classic predictive pitfalls
- Actionability gap: A score without a paired decision is shelfware. Always define what changes when the score crosses a threshold.
- Outcome leakage: Don’t train on signals that happen after the outcome; you’ll get inflated accuracy that vanishes in production.
- Confusing correlation with causation: A sidebar may appear on winning paths because high-intent users scroll more—not because the sidebar causes conversion. Validate with controlled changes.
- Ignoring drift and seasonality: Promotions, algorithm updates, or holidays change patterns. Monitor performance weekly; retrain on fresh windows.
- Optimizing the wrong thing: Predicting “page depth” is easy; predicting profitable conversions is harder but meaningful.
A simple operating model executives will back
- Define the question and the action
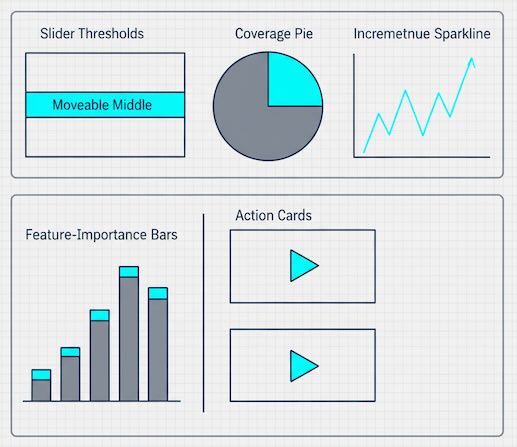
“Predict checkout completion in-session to decide whether to surface reassurance or an incentive.” - Set thresholds and capacity
“We will act on the middle 30% of scores (the ‘moveable middle’), capped at N users/day.” - Choose success metrics
“Primary: incremental revenue per visit (IRPV). Secondary: offer rate, attachment rate, margin impact.” - Run controlled comparisons
Compare model-informed actions vs. simple rules (“if cart value > $X then show offer”). Keep it fair and time-aligned. - Publish a monthly scorecard
- Calibration and precision at operating threshold
- Incremental lift and margin impact
- Share of traffic touched (coverage)
- Top features influencing decisions (for explainability)
- Next iteration focus (segments under-served, drifts spotted)
Short, visual, and tied to dollars.
Glossary for busy stakeholders
- Propensity score: Probability (0–1) an outcome occurs (convert, churn, return).
- Uplift modeling: Predicts which users will change behavior because of an action.
- Calibration: Alignment between predicted probabilities and actual outcomes.
- Moveable middle: Users whose probability is neither very low nor very high—where interventions pay off.
- Drift: When live data distribution shifts away from what the model learned.
Bottom line
Predictive analytics is not about fancy models—it’s about better timing and better bets. When your website can estimate what a visitor is likely to do next, you can guide them with the right content, reassurance, or incentive—and stop wasting effort where it won’t matter. Start by asking sharper questions, tie each prediction to a concrete decision, measure incremental impact, and protect user trust. Do that, and your site won’t just react to behavior—it will anticipate it.
Rajeev Sharma
Web analytics consultant and privacy-focused tracking specialist with over 10 years of experience. Helping businesses build measurement systems that work — without compromising user trust.
Learn more →