
Rankings get attention. Revenue pays the bills. If your content reporting stops at position, impressions, and CTR, you’re only telling the pre-click story. The post-click story—how visitors actually move, engage, and act—is where content earns its keep. This guide reframes SEO from “visibility” to value creation, using metrics that connect content to pipeline and profit without diving into implementation.
The problem with rank-only thinking
- Rank ≠ intent fit. You can hold a top spot and still underperform if the article misses searcher motivation (comparison vs. how-to vs. transactional readiness).
- Visibility ≠ value. Impressions can explode while conversions stay flat if the wrong audience is landing.
- CTR can mislead. A punchy title boosts clicks but may inflate pogo-sticking if the body fails to deliver.
Bottom line: Treat rankings as inputs. Decisions should rest on post-click evidence.
The post-click metric stack
Think in layers. Each layer answers a sharper question about fit, progress, and impact.
1) Fit: Did the content meet intent?
- Engagement depth
- Primary: median scroll depth, percent reaching 50/75/90%.
- Supporting: active time on page (idle time excluded), interaction events (tab switches, element hovers).
Signal: Depth tells you whether the structure and above-the-fold promise match search intent.
- Consumption completion
- Percent of readers who reach the end, view embedded media, or expand key accordions.
Signal: Completion indicates clarity and narrative pacing, not just length.
- Percent of readers who reach the end, view embedded media, or expand key accordions.
- Bounce with context
- “Qualified bounce” = left after 30+ seconds and 50% scroll; “thin bounce” = left quickly with shallow scroll.
Signal: Not all bounces are failures—quick answers can be successes if intent was “lookup.”
- “Qualified bounce” = left after 30+ seconds and 50% scroll; “thin bounce” = left quickly with shallow scroll.
2) Progress: Did the content advance the journey?
- Micro-conversions (content-assists)
Examples: copy a snippet, click a comparison link, use a calculator, add to reading list, start a trial checklist, view pricing, subscribe, download a guide.
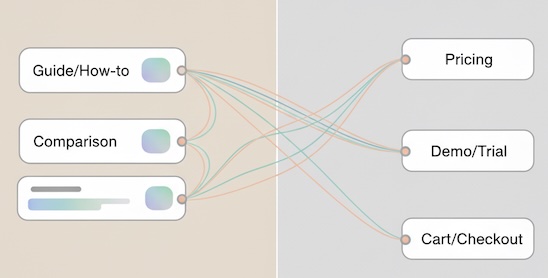
Signal: These are stones across the river—each one reduces friction to macro action. - Path transitions
- Next-page cluster rates: Category → Product, Guide → Pricing, How-to → Trial.
Signal: Shows how effectively content routes visitors to higher-intent states without forcing a hard sell.
- Next-page cluster rates: Category → Product, Guide → Pricing, How-to → Trial.
- Qualified session rate
- Share of sessions from the article that include a high-intent page (pricing, demo, cart).
Signal: Better than pageviews for prioritizing content that moves people.
- Share of sessions from the article that include a high-intent page (pricing, demo, cart).
3) Impact: Did the content contribute to outcomes?
- Article-assisted conversion rate
- Percent of conversions that included the article within a session or fixed lookback window (e.g., same day).
- Revenue per article session (RPAS)
- Attributed revenue divided by sessions that start on the article.
- Lead quality proxies
- Down-funnel activation (e.g., % of sign-ups that later reach “aha” actions after originating on this content).
Tip: Use fixed windows (e.g., 7/28 days) to avoid overclaiming and report ranges when identity resolution is limited.
Map metrics to intent (so you don’t optimize blindly)
Different queries demand different north stars:
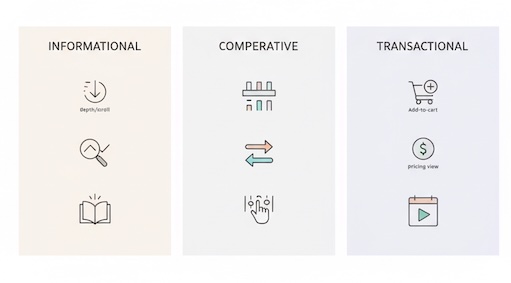
- Informational (“how”, “what”, “examples”)
- Fit: active time, depth, completion
- Progress: tool usage, related-topic click-through, newsletter opt-in
- Impact: article-assisted trials within 7 days, return-visit rate
- Comparative (“vs”, “best”, “alternatives”)
- Fit: table interactions, feature-filter usage
- Progress: click-through to product pages, pricing view rate
- Impact: demo requests per 100 readers, RPAS
- Transactional (“buy”, “pricing”, “sign up”)
- Fit: low thin-bounce, quick time-to-CTA view
- Progress: add-to-cart / start-trial from page
- Impact: conversions, AOV or LTV deltas by entry page
Aligning metrics to intent prevents chasing time-on-page when speed to value is what matters.
A simple valuation model for content
Give every article a score that reflects business value, not just traffic:
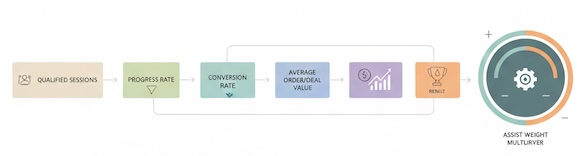
Content Business Value (CBV) =
(Qualified Sessions × Progress Rate × Conversion Rate × Avg. Order/Deal Value) × Assist Weight
- Qualified Sessions: sessions that hit an intent page within the visit.
- Progress Rate: share triggering micro-conversions (calculator start, comparison click).
- Conversion Rate: from those progressed sessions to the macro outcome, within a fixed window.
- Assist Weight: 0.3–0.7 depending on how strict you are about multi-touch credit.
This yields a comparable dollar-ish proxy to rank your portfolio.
Diagnosing underperformers (post-click triage)
When an article brings traffic but little value, isolate the failure mode:
- Shallow engagement (low 50% scroll, low active time)
- Likely cause: mismatch between headline promise and first screen; walls of text; burying the answer.
- Engaged but stalled (good depth, low micro-conversions)
- Likely cause: unclear next step; no mid-article pathways; CTAs too generic for the intent.
- Progress without impact (strong micro-conversions, weak assists)
- Likely cause: misaligned handoff (e.g., comparison clicks to irrelevant SKUs), pricing shock, or gaps in credibility.
Action framework: improve promise–payoff alignment, add journey-specific micro-CTAs (compare, size, estimate), and tighten handoffs to high-intent destinations. Keep the interventions intent-true, not “more banners.”
Benchmarks (directional, not universal)
Use these only as starting sanity checks; your niche and audience will vary.
- Median scroll 50–70% on long-form guides that genuinely answer intent.
- Active time 45–90 seconds for 1,000–1,500-word explainers; shorter for lookup, longer for deep dives.
- Pricing view rate 8–20% from comparison and “best” lists (B2C tends higher than B2B).
- Article-assisted share 10–35% of sign-ups in content-led models.
If you’re far outside these, investigate structure, handoffs, or targeting.
Micro-conversions that actually predict revenue
Not all micro-conversions are equal. Favor ones with proven downstream lift:
- Tool interactions (calculators, checkers, fit-finders) correlate strongly with readiness.
- Comparison engagement (filters used, specs toggled) outperforms generic “read more.”
- Pricing previews (hover, expand, plan comparison) beat generic newsletter signups for sales-led teams.
- Deep topic clusters (2–3 related reads in same visit) indicate problem commitment.
Track a small, curated set and drop vanity actions that rarely precede business outcomes.
Content portfolio decisions, informed by post-click data
- Scale: Articles with high CBV and stable assist share → produce variants (format, region, segment).
- Fix: High traffic + shallow engagement → rework above-the-fold promise, add scannability, move answers up.
- Reposition: Good engagement + low progress → embed intent-matched micro-CTAs and clearer next steps.
- Sunset or consolidate: Low traffic + low value over multiple cycles → merge into stronger cluster to concentrate authority.
This keeps production focused on what converts, not just what ranks.
Telling the story to stakeholders
Make your reporting “boss-friendly” and action-centric:
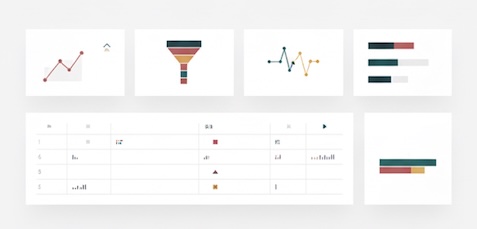
- One-slide executive view
- Top 5 articles by CBV, delta vs. last period, and the driver metric (e.g., progress rate +4.2 pp).
- Intent-aligned KPIs
- Each cluster shows its north star (e.g., “Guide → Pricing View Rate”).
- Clear next moves
- “Ship comparison table to top 3 guides (targets: +10 pp scroll-75, +3 pp pricing views).”
Avoid dashboards that start with rankings; lead with value and the levers you’ll pull next.
The takeaway
Rankings open the door. Post-click performance makes the sale. Measure fit (depth, active time, completion), progress (micro-conversions, path transitions, qualified sessions), and impact (assists, RPAS). Tie it together with a simple valuation model so you can prioritize creation, fixes, and consolidation by expected business value—not vanity metrics.
When content teams commit to measuring beyond rankings, SEO stops being a visibility function and becomes what the business actually needs: a predictable growth engine.